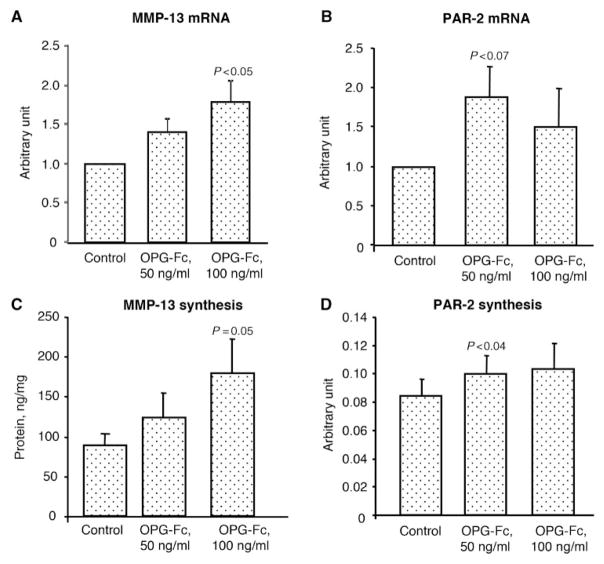
Fig. 6.
Gene expression level (n=7) of (A) MMP-13 and (B) PAR-2, and protein production of (C) MMP-13 (n=5) and (D) PAR-2 (n=8) on human OA chondrocytes upon treatment in the absence (Control) or presence of OPG-Fc at concentrations of 50 and 100 ng/ml. The gene expression level is expressed as arbitrary units over control, which was attributed a value of 1. The protein production is expressed as nanograms per milligram of protein for MMP-13 and as arbitrary units for PAR-2. Statistical analysis was assessed by paired Student’s t-test vs control.

