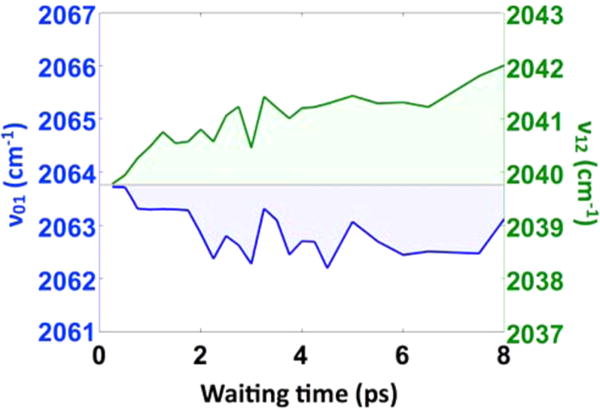
Figure 3.

Waiting time-dependent fitted band centers for the 0–1 (blue) and 1–2 (green) transitions show that the apparent time-dependent anharmonicity arises due to the simultaneous red shifting of the 0–1 band and blue shifting of the 1–2 band. Within the simple Morse oscillator model, this trend requires that the dissociation energy De increases, while the Morse width parameter a decreases (defined in the SI). Both parameters influence the harmonic force constant since kharm = 2a2De.
