
FIG. 1.
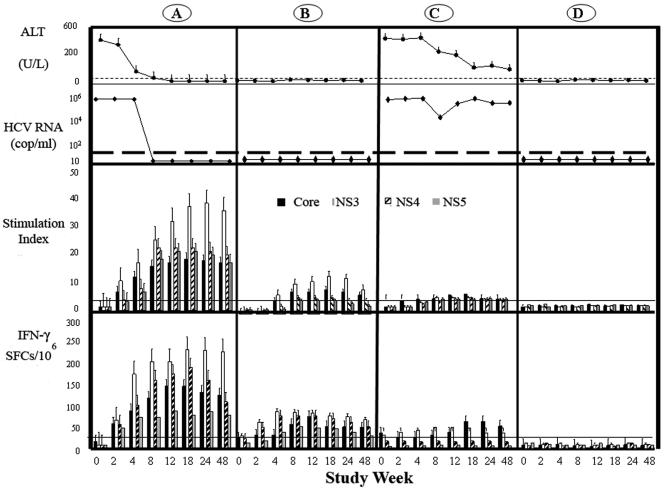
Time course of ALT, HCV RNA, and immune responses. Serum ALT, HCV RNA,CD4+ proliferative response, and IFN-γ in subjects with spontaneous recovery (A), contacts with persistent aviremia but detectable HCV-specific immune responses (B), contacts with chronic evolution (C), and noninfected contacts with no HCV (D). The upper two rows show the ALT (40 U/liter; filled circles) and mean serum HCV RNA levels (filled diamonds). The third row shows CD4+ proliferative T-cell responses to four HCV proteins (core, NS3, NS4, and NS5) expressed as SI (y axis). The cutoff for a positive response is an SI of 3. Bars represent mean responses to a given antigen, and lines represent SDs. The lower row shows numbers of SFCs expressing IFN-γ in the ELISpot assay after stimulation with core protein, NS3, NS4, and NS5. Bars represent mean responses, and lines represent SDs. Horizontal lines represent cutoff values.