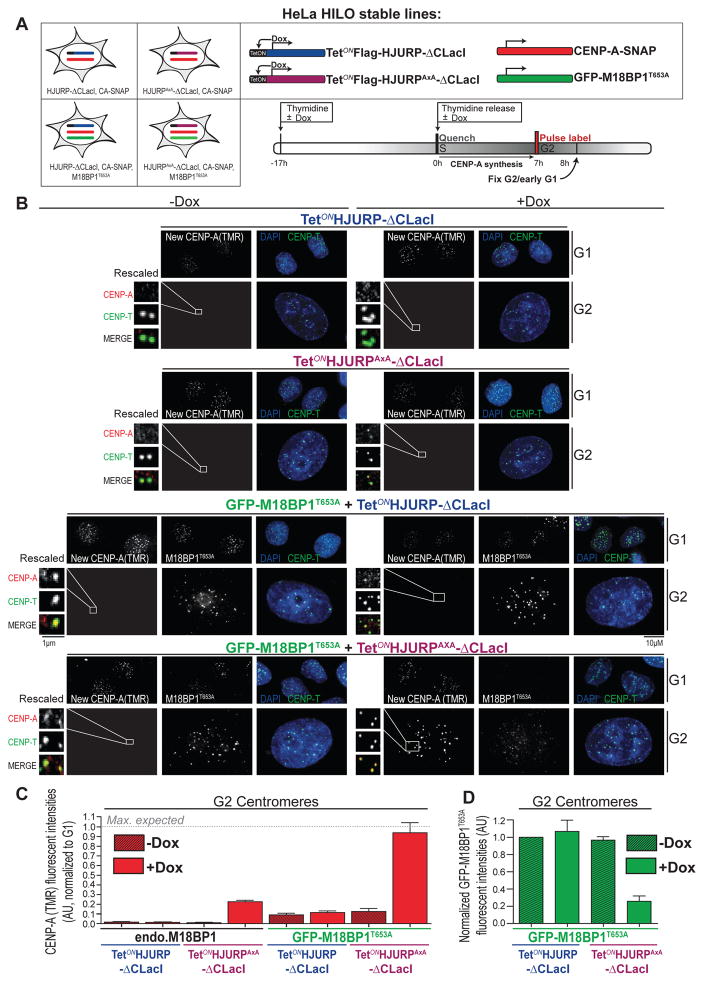
Figure 6. A dual inhibitory mechanism restricts CENP-A deposition to G1 phase (related to Figure S7).
(A) Schematic representation of Hela HILO cells carrying low levels of constitutively expressed CENP-A-SNAP (red), with or without stable expression of GFP M18BP1T653A (green) along with Doxycycline-inducible 3xFlag-HJURP-ΔCLacI (blue) or 3xFlag-HJURPAxA-ΔCLacI (purple). Cells were processes as indicated in the scheme.
(B) Representative images of the experiment described above. Following fixation, cells were counterstained for CENP-T and DAPI to indicate centromeres and DNA, respectively. Cell cycle status was determined by measuring total DAPI area (see supplemental experimental procedures).
(C) Quantification of CENP-A-SNAP fluorescent signals from (B). Average CENP-A-SNAP signals from G2 centromeres were normalized to respective G1 centromeres and corrected for centromere number (assuming signal intensity per focus represents 1 and 2 centromeres in G1 and G2, respectively). Error bars indicate SEM of 4 independent experiments.
(D) CENP-A assembly drives M18BP1 displacement from centromeres. Quantification of centromeric GFP-M18BP1T653A fluorescent signals from (B) using CRaQ method. Average GFP-M18BP1T653A signals were normalized to uninduced 3xFlag-HJURP-ΔCLacI expressing cells. Error bars indicate SEM of 4 independent experiments.

