
Figure 1.
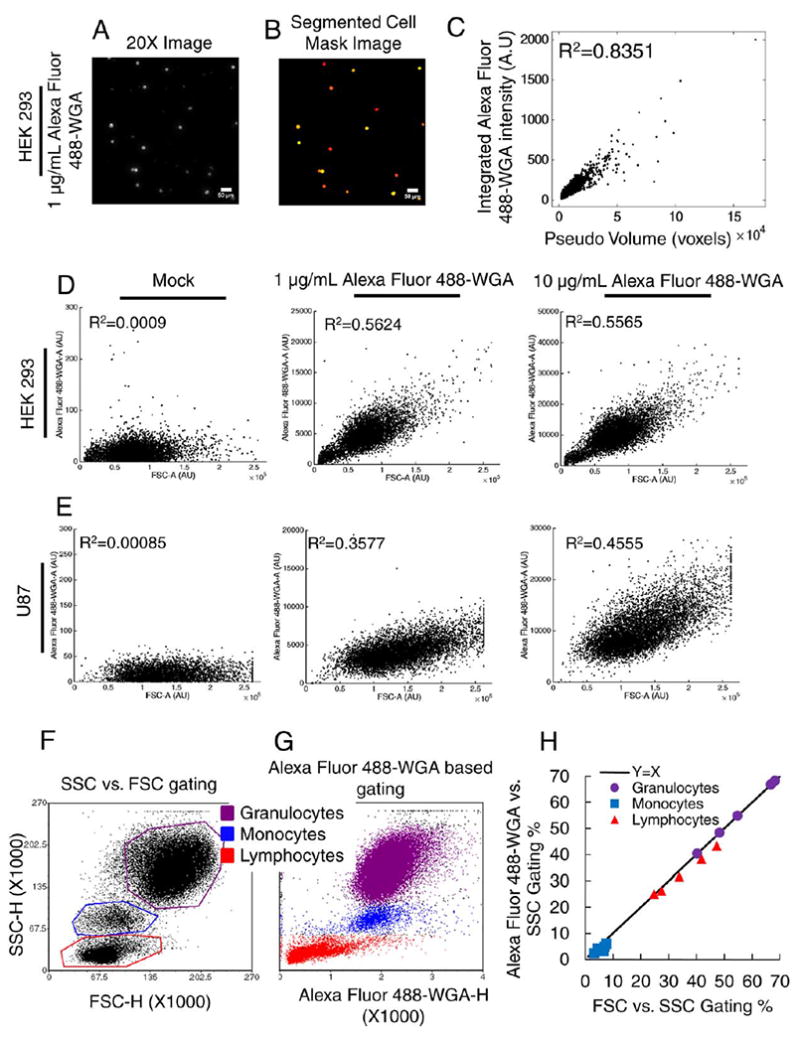
Establishing Wheat Germ Agglutinin Staining Intensity as a Metric for Cell Size. A-C: Imaging of A488-WGA-stained HEK293 cells. Representative fields of view are shown for 20X fluorescence images (intensity adjusted image displayed for illustration purposes only) (A) or processed images (B). Individual cells were identified from the processed images and the integrated fluorescence intensity and area were calculated. Data for each cell are shown in (C). Pseudo volume is cell area raised to the 3/2 power. D, E: WGA-stained HEK293 (D) and U87 cells (E) were subjected to flow cytometry (see Methods), and the correlation between FSC and WGA staining intensity is shown. F–H: Blood samples were subjected to flow cytometry analysis and gating to discriminate between granulocytes, monocytes and lymphocytes was applied based on FSC vs. SSC data (F) or WGA vs. SSC data (G). Consistency of cell type proportions between the two gating strategies are shown in (H). [Color figure can be viewed at wileyonlinelibrary.com]