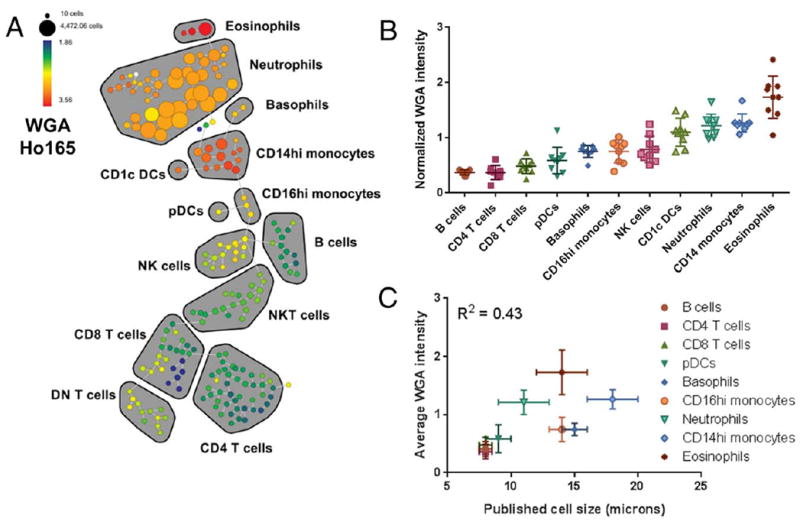
Figure 2.

WGA intensity in mass cytometry analysis of human whole blood. Whole blood was stained with a panel of antibodies to identify major immune subsets together with WGA-A488 detected with an Ho165-tagged anti-A488 secondary antibody, and the data were visualized using SPADE. WGA staining in a representative sample is shown across the SPADE tree as fold change relative to MMO control (A). Major immune populations are delineated on the tree based on canonical marker expression. The median normalized WGA staining intensity is shown for the identified immune cell subsets in 8 separate individuals (B), and the average intensity is correlated with the published diameters of the corresponding cell subsets (C and Table 2). [Color figure can be viewed at wileyonlinelibrary.com]
