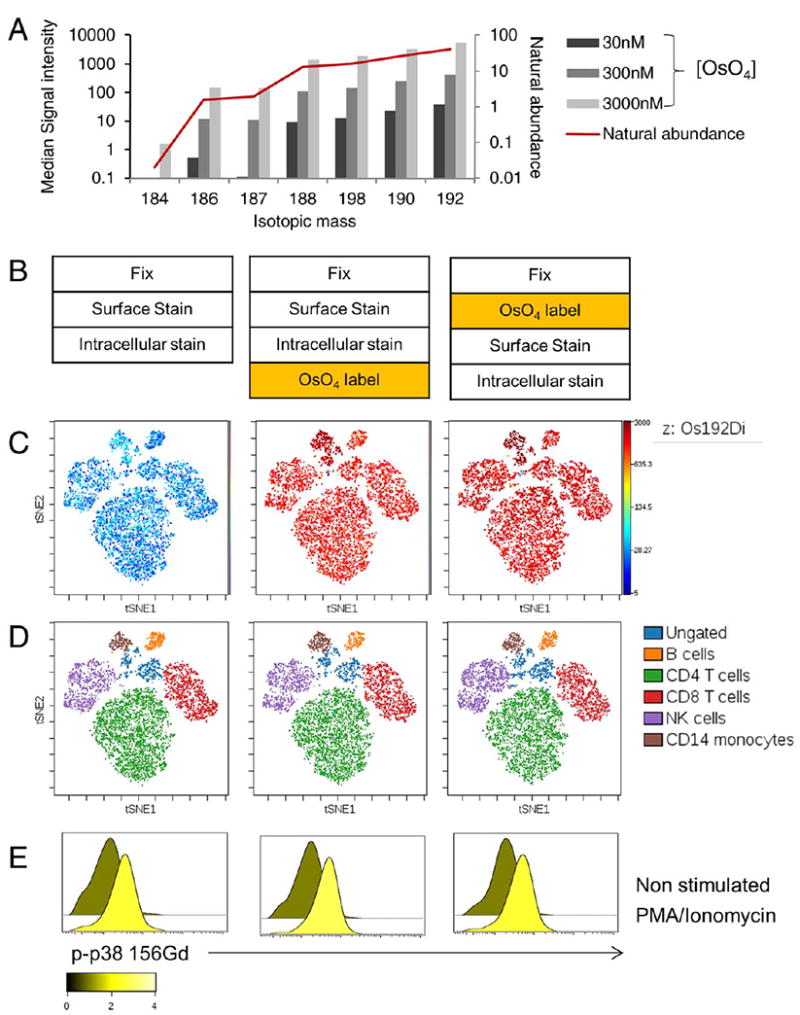
Figure 3.

Validation of OsO4 in Mass Cytometry (A) Fixed PBMCs were stained with increasing concentrations of OsO4 and median signal intensity for all gated cell singlets was evaluated for all osmium isotopic mass channels and compared to natural isotopic abundance. B-E: Resting and PMA-stimulated PBMCs were fixed and stained with a panel of antibodies against surface markers and intracellularly with an antibody stained against phospho-p38. OsO4 staining was performed either before or after antibody staining (B). The data were visualized using viSNE to map the multi-dimensional data to two-dimensional space (C-D). Os192 expression is shown across all populations on the map (C) and major immune populations on the map were manually identified using global gates based on canonical marker expression patterns (D). Phospho-p38 expression is shown for the gated T cell population (E), and the overlaid histograms are colored based on the fold change between the stimulated and non-stimulated control samples. [Color figure can be viewed at wileyonlinelibrary.com]
