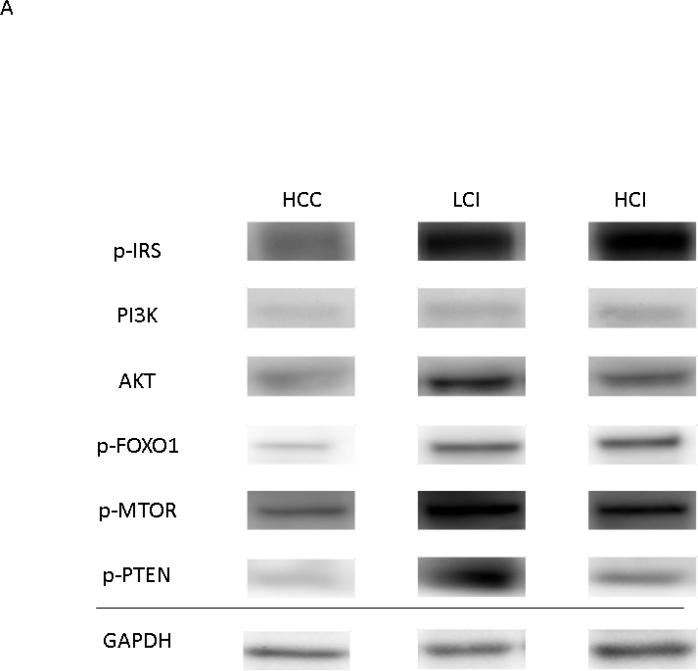
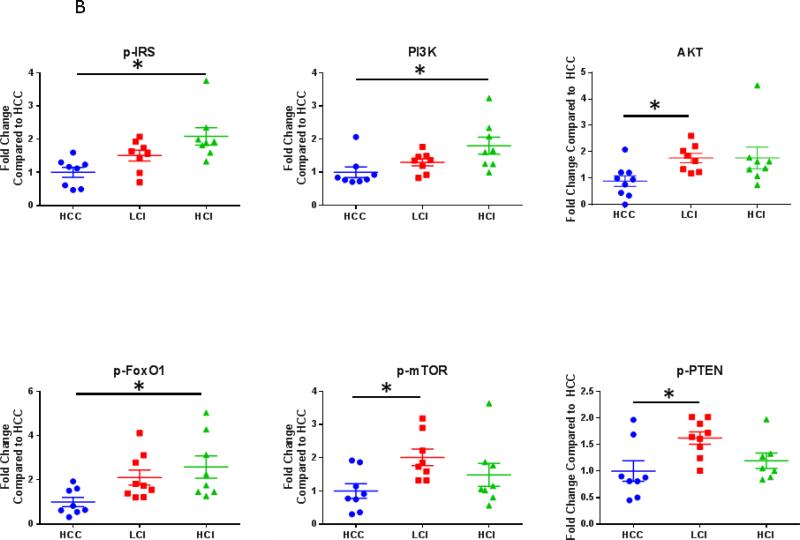
Figure 6. Calpain Inhibition Increases Expression of Proteins involved in Cell Growth and Proliferation.
A: Representative Images from Western Blot with protein specific antibodies as shown at the left. All images shown in for each protein are from the same Western blot membrane using different antibodies as indicated. GAPDH shows representative images for loading control. B: The bar diagrams show significant changes in pro survival signaling proteins. HCC-_ High Cholesterol Control, LCI- Low Dose Calpain Inhibitor, HCI- High Dose Calpain Inhibitor; *= p<0.05 by Kruskal-Wallis and Dunn's Post Hoc Comparisons


