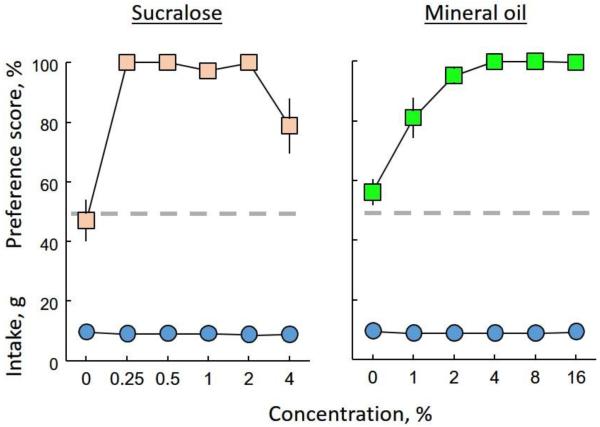
Figure 1.
Results of 48-h two-cup choice tests between plain chow and chow with ascending concentrations of sucralose (left; n = 12) or mineral oil (right; n = 12). Circles show total daily food intake (i.e., intake of plain food + intake of food with palatability agent); square symbols show preference scores (i.e., intake of food with palatability agent/total food intake × 100). Horizontal dashed lines show 50% preference score (indifference). Vertical bars on symbols are SEMs; where not shown, the SEM was smaller than the symbol).

