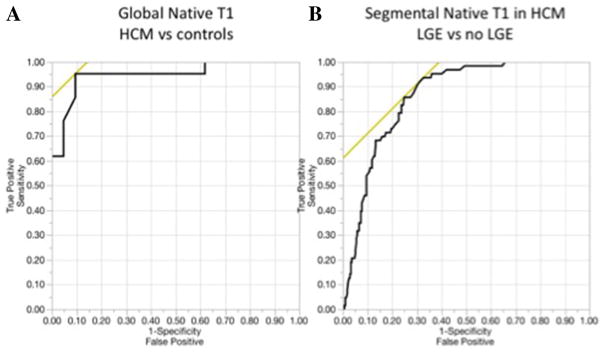
Fig. 4.
Receiver operating characteristic curves a ROC for determining a cut-off for the global LV native T1 value of controls vs. patients with HCM. A T1 cut-off value of 987 ms yielded sensitivity of 95 % and specificity of 91 % with an area under the ROC of 0.95 (95 % confidence interval, 0.83–0.99). b The cutoff LV native T1 of 1019 ms yielded a sensitivity of 94 % and specificity of 67 % to differentiate segments with and without LGE in patients with HCM and had an area under the ROC of 0.86 (95 % confidence interval, 0.82–0.90)

