
Figure 3. TOMAHAQ analysis has precision and sensitivity comparable to a fractioned proteome-wide experiment.
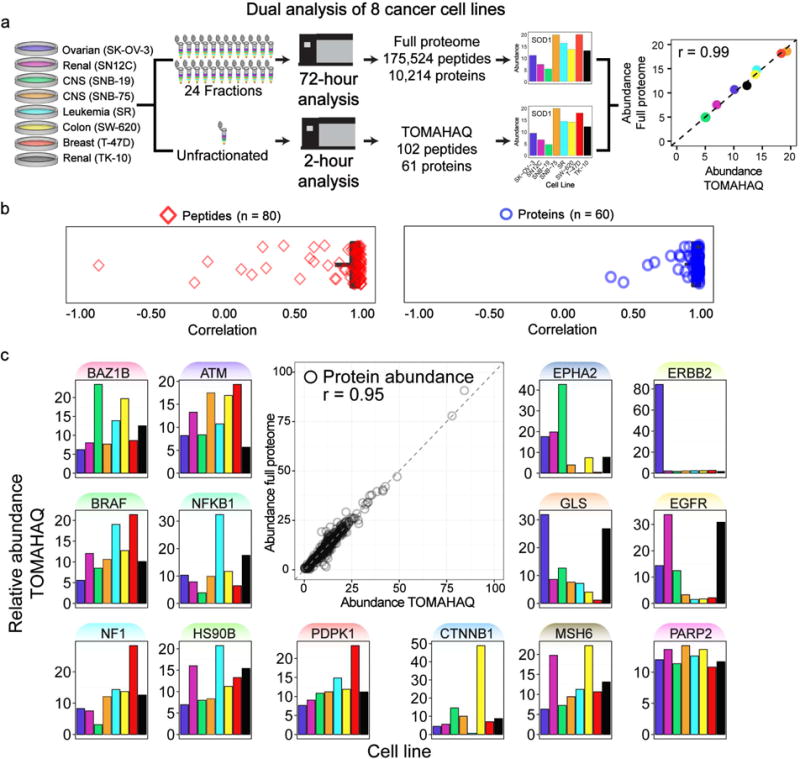
(a) Eight cancer cell lines were digested, labeled with TMT, mixed and split into two samples. One was separated via basic pH reverse-phase fractionation into 24 fractions (requiring 72 hr of analysis), and the remaining sample was left unfractionated (used for 2 hr TOMAHAQ analysis). Peptides and proteins quantified in both methods were compared for quantitative accuracy and precision. An example correlation for Superoxide dismutase (SOD1) is displayed. (b) Pearson correlation was calculated for all peptides identified in both methods (median = 0.97, mean = 0.85). Rarely, peptide measurements derived from the full proteome dataset showed reduced correlation values likely due to interference. Utilizing protein-level quantification (combined peptides) resulted in improved correlations (median = 0.99, mean = 0.94). (c) The correlation for all protein measurements from both methods was assessed to be 0.95. Notable proteins exhibiting dynamic protein abundance in the eight cell lines are highlighted. See also Fig. S3, Table S2