
FIG. 3.
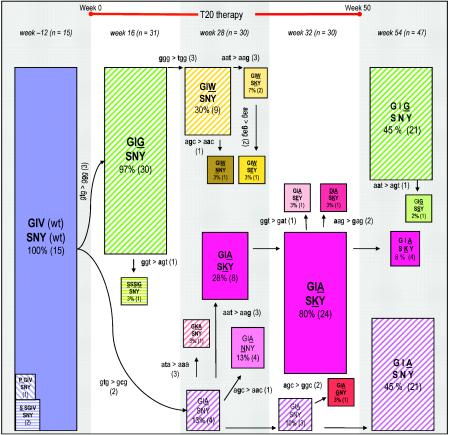
Evolution of T20 resistance in the ectodomain of HIV-1 gp41. This schematic of the viral quasispecies in the course of T20 therapy focuses exclusively on the GIV sequence in HR1 and the SNY sequence in HR2. The situation is depicted at week -12 (pretherapy), weeks 16, 28, and 32 (during T20 therapy), and week 54 (posttherapy). The number of clones that were sequenced per time point is indicated by n. The initial virus population present at week -12 consists of the fully wild-type sequence (GIV-SNY). The starting virus population is shown as a blue box, all single mutants are shown as hatched and colored boxes (e.g., GIG-SNY at week 16) and the double mutants in full color boxes (e.g., GIA-SKY at weeks 28 and 32). The sizes of the boxes reflect the abundance of that particular variant within the viral population. The actual percentage of that variant in the viral quasispecies and the number of clones with that sequence are indicated within the boxes. The evolution scheme was derived in part from inspection of the actual codon changes that are indicated alongside the arrows. The mutations are ranked according to their likelihood (2, 17, 18): the easy G-to-A and C-to-T transitions (1), the more difficult A-to-G and T-to-C transitions (2), and all transversions (3).