3.
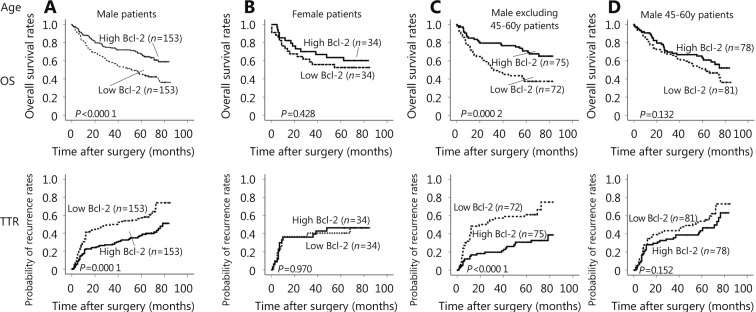
Kaplan-Meier curves of survival differences among HCC patients. (A) OS and TTR for Bcl-2 expression in male patients. (B) OS and TTR for Bcl-2 expression in female patients. (C) OS and TTR for Bcl-2 expression in male patients, excluding those in the 45–60-year-age group. (D) OS and TTR for Bcl-2 expression in 45–60-year-old male patients.

