
FIG. 1.
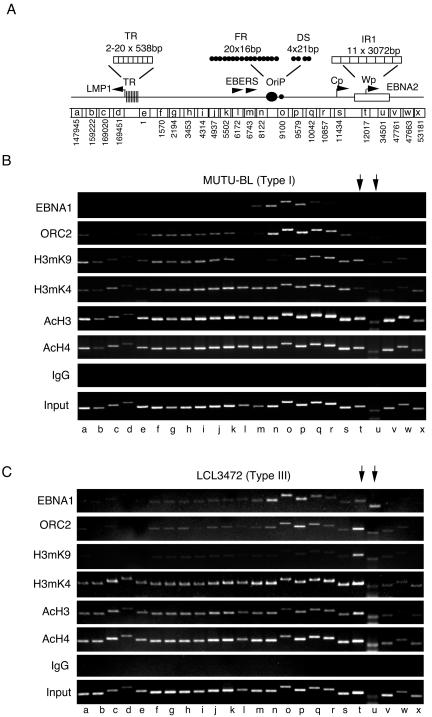
Histone modifications at EBV latency control region. (A) Schematic representation of the EBV latency control regions covering the LMP1 sequences at the left to the EBNA2 transcript region to the right. Sequence numbers below correlate to EBV coordinates (National Center for Biotechnology Information, gi:9625578) and indicate the left-flanking primer used for ChIP amplification. Each ChIP amplicon is ∼400 to 600 bp and is designated by lowercase letters. LMP1, TR, family of repeats (FR), EBERs, OriP, DS, and IR1 are indicated. (B) MutuI BL cell lines were assayed by ChIP with the specific antibodies, control IgG, and input DNA as indicated. EBV genome positions correlate with the schematic in panel A and are indicated by lowercase letters below. (C) LCL3472 cells were assayed in the same manner as described in panel B.