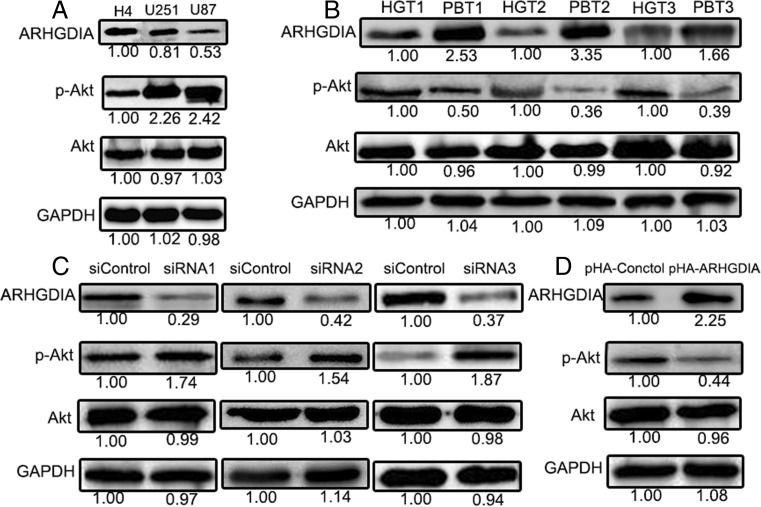
Fig. 6.
The Akt phosporylation level in human glioma cell lines (a, c) and in 3 randomly chosen HGTs (b, d). The 3 randomly chosen HGTs were the same samples used in the Fig. 1. The Akt phosporylation level was correlative with ARHGDIA expression in U87 cells and HGTs. siControl and pHA-control were the nontargeting control siRNAs or the empty transfection vector. pHA-ARHGDIA was ARHGDIA-overexpressing plasmid. p-AKT was the phosphorylated AKT

