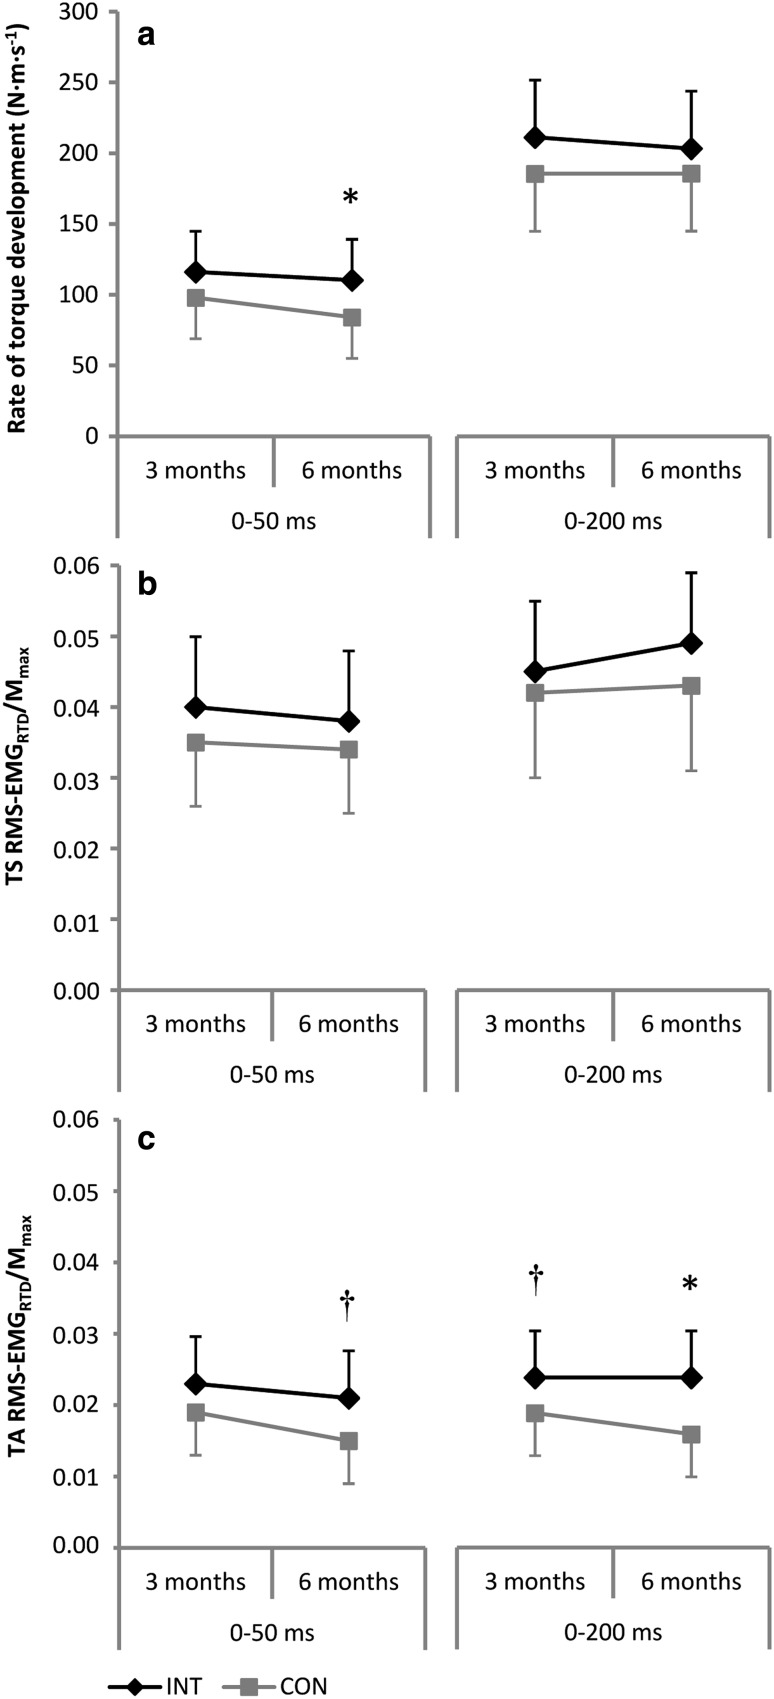
Fig. 4.
Effect of the training intervention (INT) on rate of torque development (a), normalized muscle activity of the triceps surae (TS RMS-EMGRTD/M max, b) and normalized muscle activity of the tibialis anterior muscle (TA RMS-EMGRTD/M max, c) in the time intervals 0–50 and 0–200 ms. †Denotes a statistical tendency towards a significant difference between groups (P ≤ 0.10). CON control group, TS triceps surae, TA tibialis anterior

