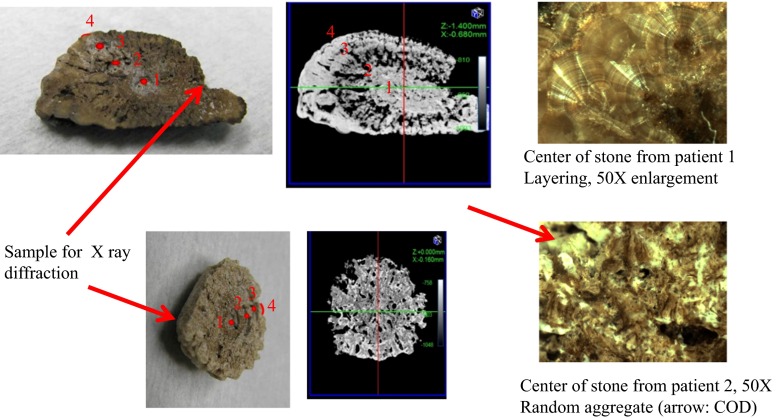
Fig. 1.
The top panel shows the stone taken from patient 1. On the left side a photo of the stone after it was cut into two halves. In the middle is a CT photo taken of the middle plane of the intact stone. On the right hand is a micrograph of the center of the stone. Guided by the CT scan, the points 1–4 were chosen to take samples for age determination. Site 1 is inside the mineral center of the stone. Site 2 is where the mineral center goes over into a more organic layer. Site 3 is at the other side of that organic layer. Site 4 is in the mineral outer layer of the stone. Along the same axis PIXE analysis was performed to determine the relative presence of elements. The lower panel shows the stone taken from patient 2. The CT does not show the layering as in stone 1. At four sites along the axis from the stone center to the outer surface samples were taken for the age determination. PIXE analysis was performed along the same axis

