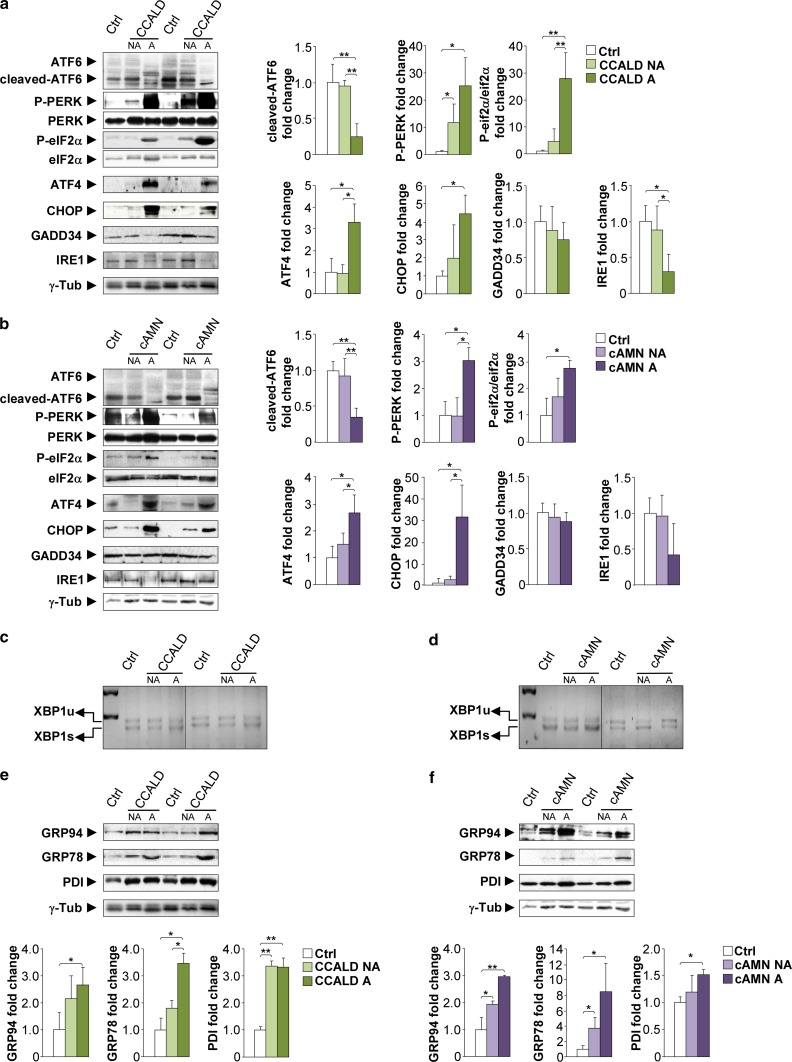
Fig. 1.
a, b Induction of the UPR in CCALD and cAMN patient brains. Representative immunoblots for full-length ATF6, cleaved-ATF6, total PERK, phosphorylated PERK (P-PERK), eIF2α, phosphorylated-eIF2α (P-eIF2α), ATF4, CHOP, GADD34 and IRE1 levels in total lysates from controls (Ctrl) and in normal-appearing (NA) and affected (A) white matter from CCALD (a) and cAMN patients (b). XBP1 mRNA splicing analysis by RT-PCR in Ctrl samples and NA and A white matter from CCALD (c) and cAMN patients (d). Unspliced- and spliced-XBP1 mRNA corresponds to XBP1u mRNA and XBP1s mRNA, respectively. Representative immunoblots for GRP78, GRP94, and PDI levels in Ctrl samples and NA and A white matter from CCALD (e) and cAMN patients (f). Protein levels were normalized relative to γ-tubulin (γ-Tub). The histograms on the right (a, b) and below (e, f) show the ratio and the protein levels relative to control. All values are expressed as the mean ± SD (n = 5 by genotype and condition in a–f; *P < 0.05 and **P < 0. 01, one-way ANOVA followed by Tukey’s HSD post hoc test for a, b, e and f)

