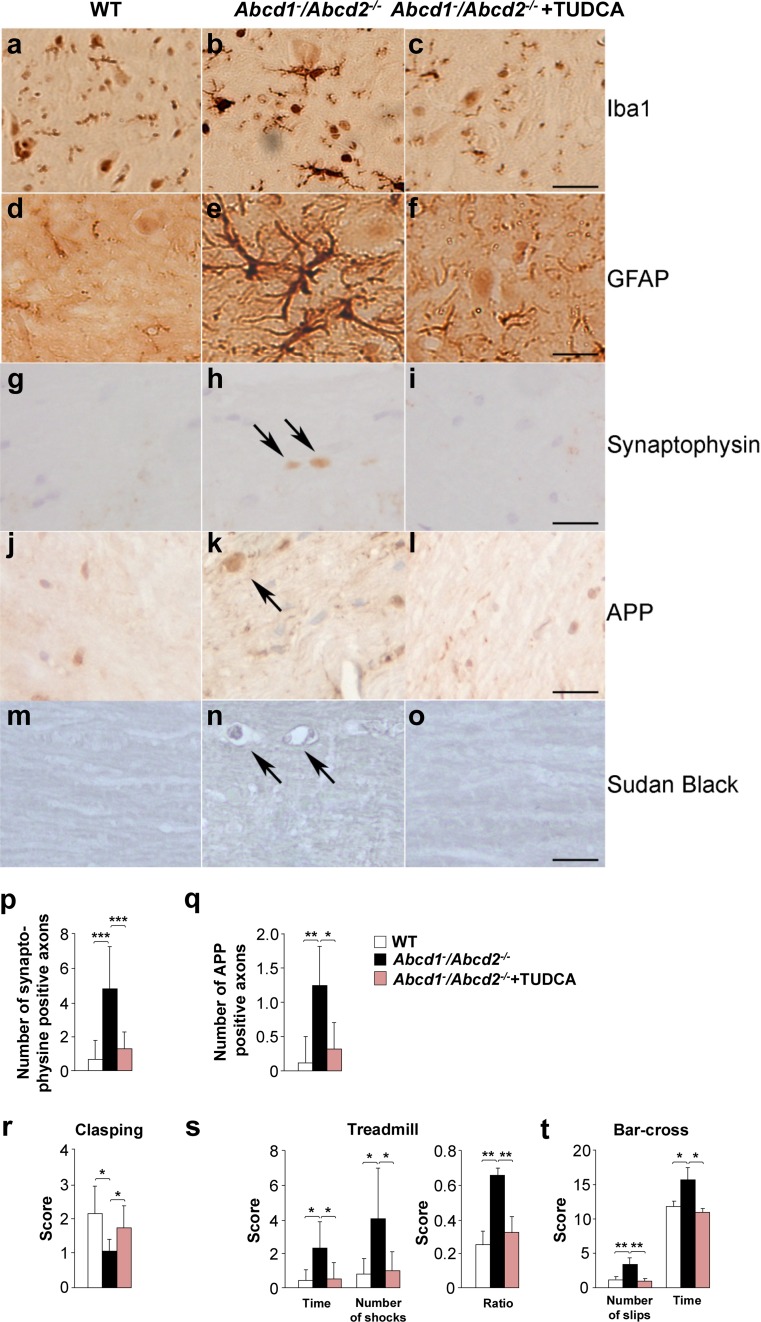
Fig. 6.
a–q TUDCA halts axonal degeneration and locomotor disability in Abcd1 − /Abcd2 −/− mice. Immunohistological analysis of axonal pathologies performed on WT, Abcd1 − /Abcd2 −/− and TUDCA-treated Abcd1 − /Abcd2 −/− mice (Abcd1 − /Abcd2 −/− + TUDCA) of 18 months of age. Spinal cord immunohistological sections were processed for a–c Iba1, d–f GFAP, g–i synaptophysin, j–l APP and m–o Sudan black. Representative images for WT (a, d, g, j and m), Abcd1 − /Abcd2 −/− (b, e, h, k, and n), and Abcd1 − /Abcd2 −/− + TUDCA (c, f, i, l and o) mice are shown. Bars 25 µm. The quantification of synaptophysin (p) and APP (q) in 1-cm-long longitudinal sections of the dorsal spinal cord in WT, Abcd1 − /Abcd2 −/− and Abcd1 − /Abcd2 −/− + TUDCA mice at 18 m of age (n = 5 mice per genotype and condition). The number of abnormal specific profiles was counted at every ten sections for each stain. At least five sections of the spinal cord were analysed per animal and per stain. Clasping (r), treadmill (s) and bar cross (t) tests were conducted on WT, Abcd1 − /Abcd2 −/− and TUDCA-treated Abcd1 − /Abcd2 −/− mice (Abcd1 − /Abcd2 −/− + TUDCA) 17 months of age. r The best performance score of each animal was used for statistical analysis [19]. s The latency to falling from the belt (time of shocks), the number of shocks received and the ratio were computed after 5 min. t The time spent to cross the bar and the numbers of slips of the hind limbs were quantified. Values are expressed as the mean ± SD (n = 5 per condition in a–q; n = 15 per condition in r–t; *P < 0.05, **P < 0.01 and ***P < 0.001, one-way ANOVA followed by Tukey’s HSD post hoc test)

