Figure 1.

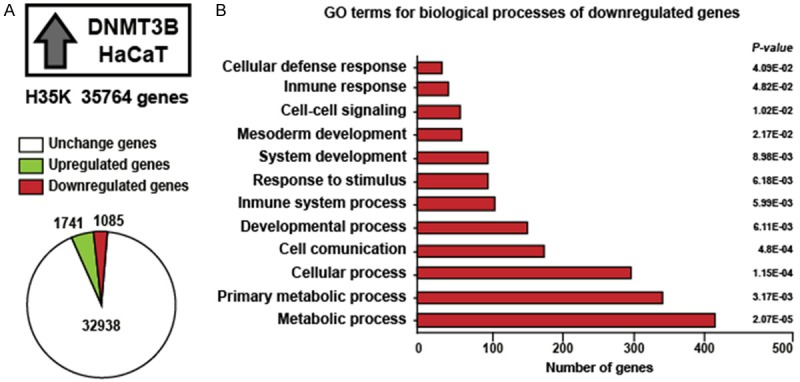
Gene ontology analysis of downregulated genes by overexpression of DNMT3B in HaCaT cells. A: We used H35K array of 35764 genes, the graph shows the number of genes that change their expression by overexpression of DNMT3B. B: Gene ontology (GO) analysis for downregulated genes by overexpression of DNMT3B.
