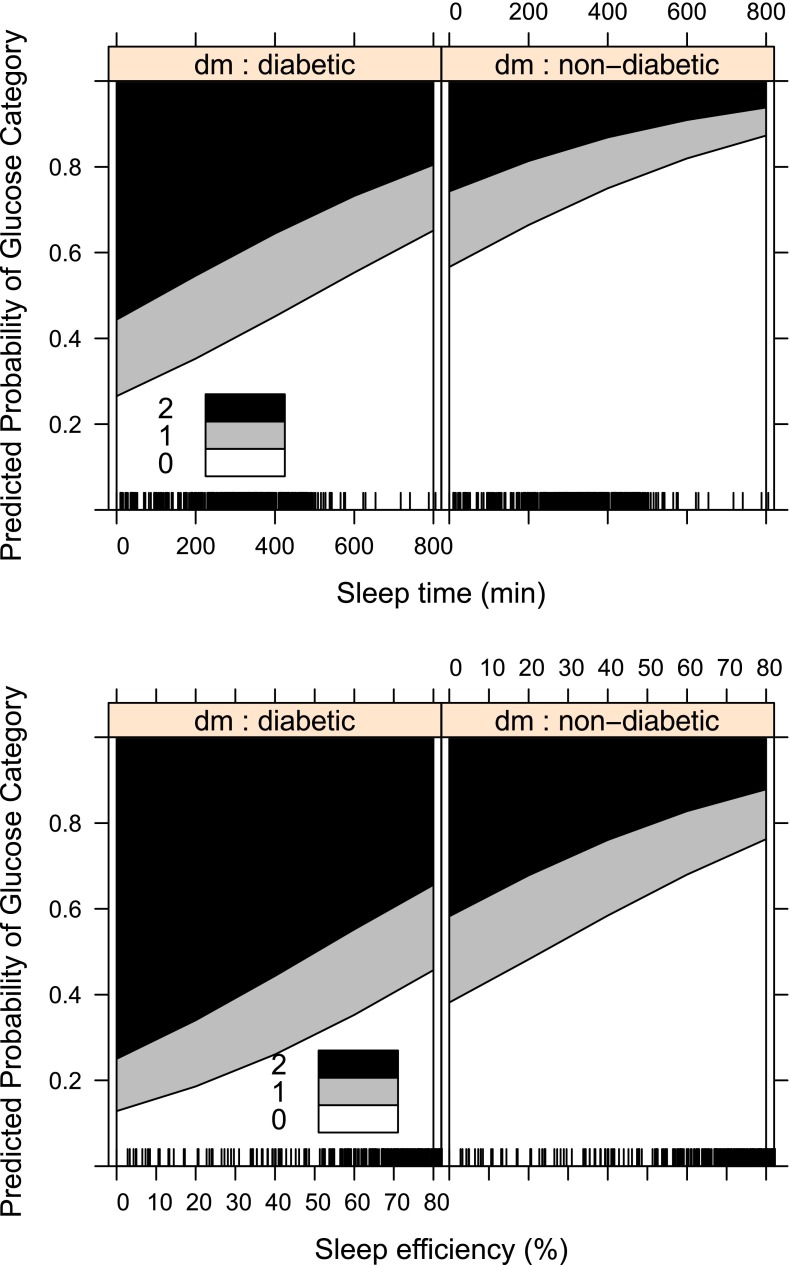
Figure 1.
Ordinal logistic regressions separated by diabetes diagnosis status comparing sleep time (top) and sleep efficiency (bottom). 0 refers to the probability of having glucose within normal limits (60–110 mg/dL), 1 refers to the probability of having elevated glucose (110–126 mg/dL), and 2 refers to the probability of having hyperglycemia (≥126 mg/dL) (using World Health Organization criteria).

