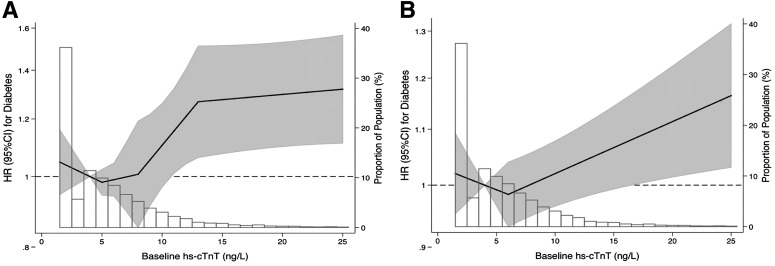
Figure 2.
Adjusted HR and 95% CI of incident diabetes by hs-cTnT level with superimposed frequency histograms. A: The linear spline model has three knots at 5, 8, and 14 ng/L. B: The linear spline model has one knot at 6 ng/L. The hs-cTnT level is represented by solid lines and the 95% CI is represented by the shaded area. The data were truncated at the 99th percentiles. The models were adjusted for age, race-center, sex, total cholesterol, HDL-C, LDL-C, triglycerides, BMI, eGFR, systolic blood pressure, blood pressure–lowering medication use, smoking status, cholesterol-lowering medication use, and fasting glucose.

