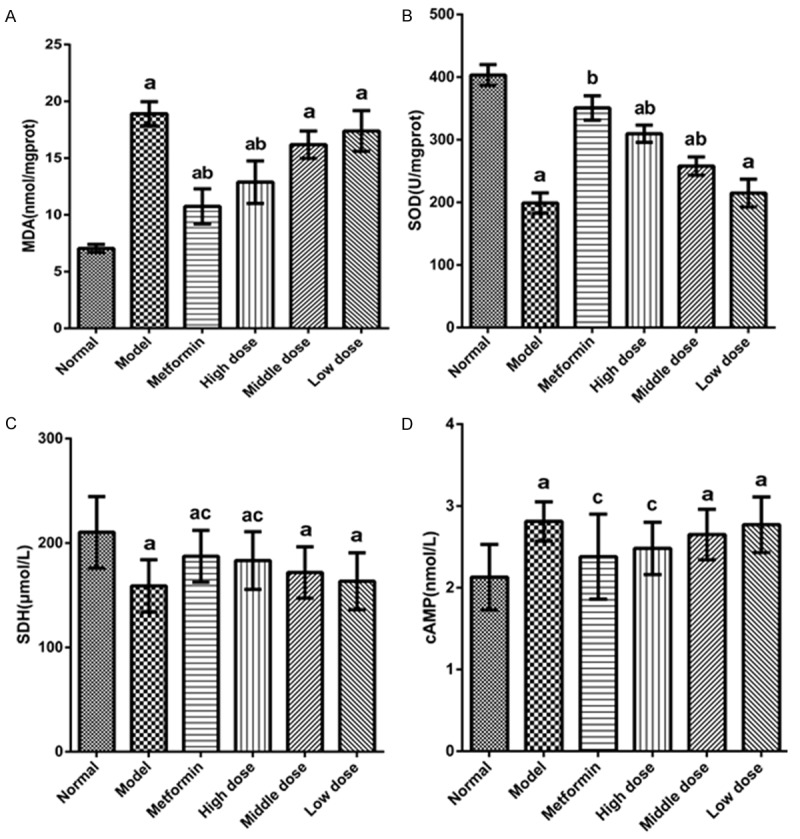
Figure 6.

Effect of EACJ treatment on oxidant/antioxidant enzyme activities in liver cortex. A: MDA; B: SOD; C: SHD; D: cAMP. Normal control: administered distilled water; Model control: administered distilled water; Metformin: 320 mg/kg of metformin; High dose: 100 g/kg of EACJ; Middle dose: 50 g/kg of EACJ; Low dose: 25 g/kg of EACJ. The results are presented as the means ± SE for 10 animals in each group. aP < 0.01 compared with the normal control group; bP < 0.01, cP < 0.05 compared with the model group.
