
Figure 4.
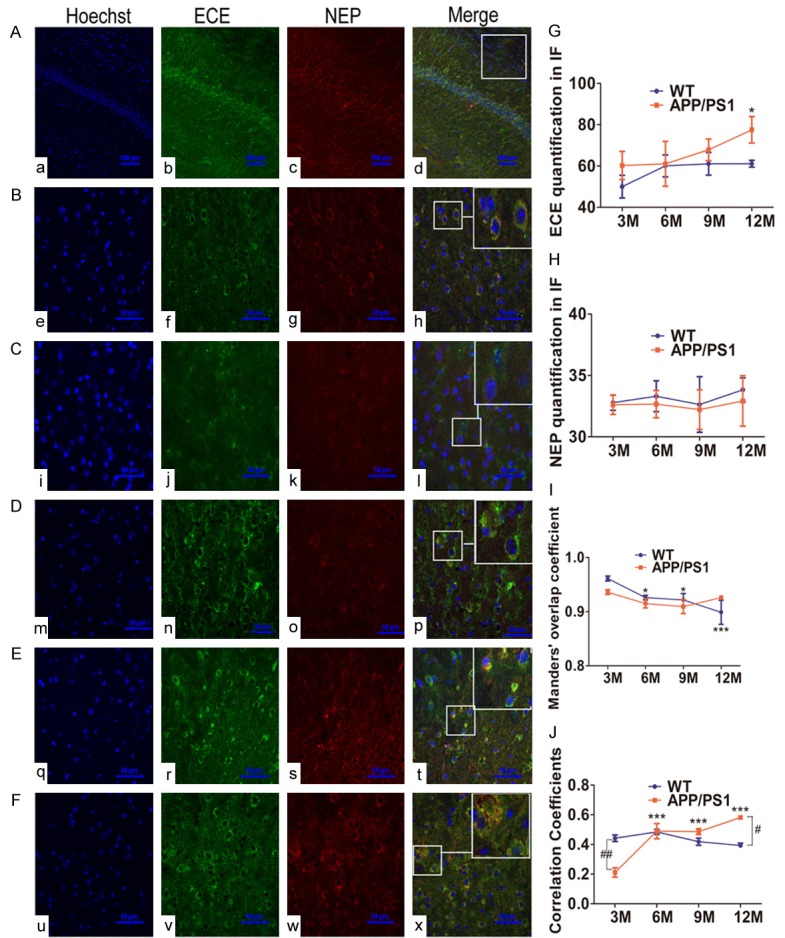
Alterations of NEP and ECE colocalized in brain slices from APP/PS1 and WT mice. A: Images showing ECE and NEP immunoreactivity in 6 M WT mice (200×), staining with anti-ECE (green) (b, f, j, n, r, v) or anti-NEP (red) (c, g, k, o, s, w). The nuclei (a, c, i, m, q, u) were counterstained with Hoechst 33342. Scale bar=100 μm. B-F: Higher magnification views for 6 M WT, 3 M, 6 M, 9 M, 12 M APP/PS1 mice, respectively (600×). Scale bar =50 μm. Colocalization was determined by confocal imaging (d, h, l, p, t, x). G and H: Brain slices from various ages of WT mice and transgenic APP/PS1 mice for relative ECE and NEP average signal density (IOD/AOI) were measured and quantified using Image-Pro Plus 6.0 software, respectively. I and J: MOC and PCC were performed to analyze the colocalization of ECE and NEP. Error bars represent SD, n=3. *P<0.05, ***P<0.001 compared with 3 M WT or APP/PS1 mice. #P<0.05, ##P<0.01 vs the age-matched WT mice.