
FIG. 1.
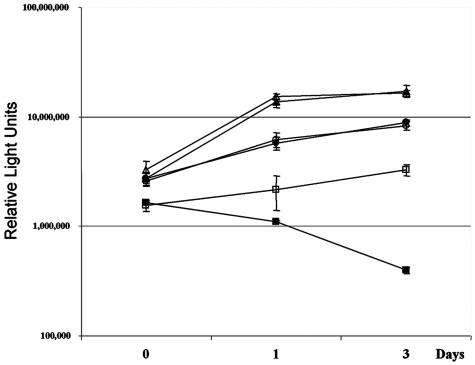
Effect of estrogen starvation on growth of EBNA2-transduced EREB2-5 cells. Ten thousand cells/well were plated into 96-well plates, and cell proliferation was monitored using the CellTiterGlo assay to measure ATP usage. LK2-EREB2-5 cells with estrogen (□) and without estrogen (▪), LK2-EBNA2 cells with estrogen (▵) and without estrogen (▴), and LK2-EBNA2ΔCR4 cells with estrogen (○) and without estrogen (•) are shown. Data shown are the means for three assays, with standard deviations provided.