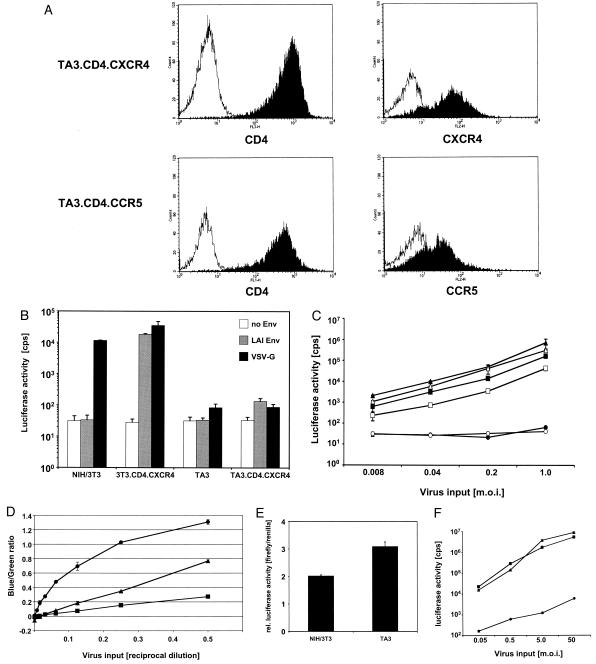
FIG. 1.

Murine TA3 cells restrict HIV infection. (A) Expression of human CD4, CXCR4, and CCR5 on TA3.CD4.CXCR4 cells (top) and TA3.CD4.CCR5 cells (bottom). The cells were stained with monoclonal antibodies against human CD4, CXCR4, and CCR5. CD4 is shown in the left panels, and coreceptor molecules are in the right panels. Isotype control stainings are represented by the unfilled curves for comparison. (B) Comparison of the transduction efficiency of HIV-1 vectors on murine NIH 3T3 fibroblasts and murine TA3 cells expressing human CD4 and human CXCR4. Predicted MOIs of 0.4 (NIH 3T3) and 2 (TA3) were used in the challenges depicted. Env-negative virus was generated in parallel transfections, and comparable volumes were used in the infections. NIH 3T3, NIH 3T3.CD4.CXCR4, TA3, and TA3.CD4.CXCR4 were challenged with HIVluc without envelope, pseudotyped with LAI Env, or VSV-G. Three days after infection luciferase activity was assayed. Luciferase counts per second (cps) are indicated on the ordinate (logarithmic scale). (C) Restriction is independent of envelope properties. NIH 3T3.CD4.CCR5 (triangles), HuT78/CCR5 (squares), and TA3.CD4.CCR5 (circles) cells were challenged with increasing amounts of HIVluc/ADA (open symbols) and HIVluc/VSV-G (solid symbols). Three days after challenge, infections were assayed by measuring luciferase activity, which is shown as a function of virus input (MOI). Each point represents the average of duplicate samples and is depicted with the standard deviation. (D) Entry of HIV/VSV-G into murine T cells, murine fibroblasts, and human T cells. TA3 (circles), NIH 3T3 (triangles), and HuT78/CCR5 (squares) cells were challenged in a twofold dilution series with HIVRP/VSV-G incorporating β-lactamase (BlaM) fused to Vpr. The cells were then loaded with the BlaM substrate CCF4-AM, which forms a 460 nm (blue) fluorescent product in the presence of BlaM. The 538 nm (green) fluorescent cells are negative for virus penetration. The ratio of blue fluorescence to green fluorescence is proportional to the fraction of cells that have fused with the HIVRP. (E) Comparison of LTR promoter to SV40 promoter activity in murine T cells and fibroblasts. NIH 3T3 and TA3 cells were cotransfected with the vector plasmid pHIVluc (expressing luciferase under transcriptional control of the HIV-1 LTR) and pRL-SV40 (expressing Renillaluciferase under transcriptional control of the SV40 promoter) in a ratio of 4:1, and the activities of firefly luciferase and Renilla luciferase were measured. The y axis shows the ratio of firefly luciferase (cps) over Renilla luciferase (cps) activity in a mean of two transfected wells, each measured in triplicate. (F) Challenge with a vector carrying an internal SV40 promoter. NIH 3T3 (triangles), HuT78/CCR5 (squares), and TA3 (circles) cells were challenged with increasing amounts of HIV-SVluc (carrying the firefly luciferase reporter gene under transcriptional control of the SV40 promoter) pseudotyped with VSV-G. Infections were assayed by measuring luciferase activity, which is shown as a function of virus input (MOI). Each point represents the average of duplicate samples and is depicted with the standard deviation.
