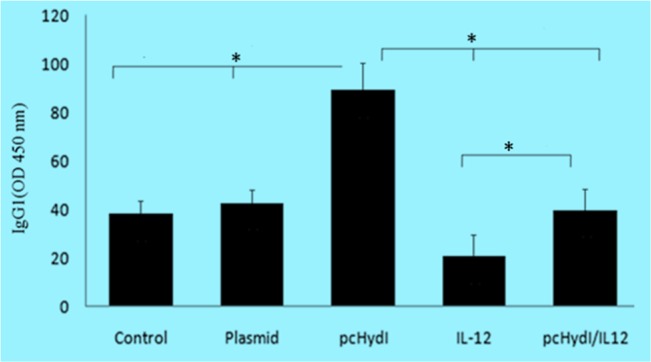
Fig. 5:
The levels of IgG1 antibody in the sera obtained two weeks after the last immunization were determined. Values represent the mean ± SE. Sera were used at 1/100 dilutions. O.D., optical density at 450 nm. Statistically significant differences (P < 0.05) are indicated by (*) compared with control, plasmid, pcHydl, IL-12 or pcHydl/IL-12 group

