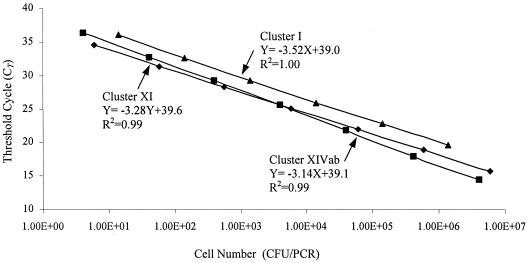
FIG. 2.
Standard curves generated by analysis of a dilution series of DNA extracted from mixed cultures of representative strains for each Clostridium cluster by real-time PCR. The CT values are plotted against the corresponding cell numbers in the PCR. ▴, Clostridium cluster I; ⧫, Clostridium cluster XI; ▪, Clostridium cluster XIVab.

