Fig. 1.

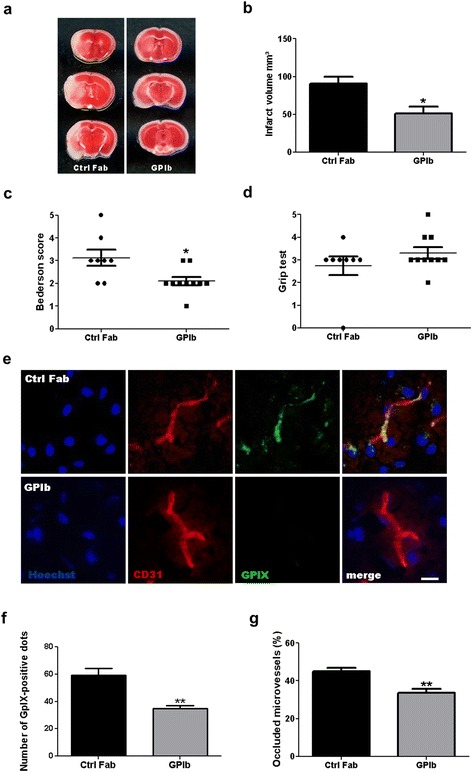
Infarct size, neurologic scoring, and brain microvascular thrombosis 24 h after stroke induction. a Representative TTC stainings of three corresponding coronal brain sections of mice treated with rat IgG Fab (Ctrl Fab) or p0p/B Fab (GPIb) 24 h after induction of tMCAO. Ischemic infarctions appear white, while vital tissue is stained red. b Infarct volumes as measured by planimetry (n = 8–10/group). c Bederson score and d Grip test score 24 h after tMCAO (n = 8–10/group). e Representative immunocytologic stainings of platelet aggregates within the vasculature from the ipsilateral hemisphere of mice, treated with rat IgG Fab (Ctrl Fab) or p0p/B Fab (GpIb) on day 1 after tMCAO. Hoechst depicts cell nuclei, CD31 stains endothelial cells, and GPIX represents platelet aggregates. Scale bar, 10 μm. f Quantification of ipsilesional glycoprotein IX (GPIX)-positive aggregates in GPIb-treated mice when compared with control mice. (n = 5 or 6/group). g Quantification of occluded ipsilesional vessels in hematoxylin–eosin (H&E)-stained brain sections on day 1 after tMCAO (n = 5–6/group). b, f, g, *P < 0.05, **P < 0.01, unpaired Student’s t test. c, d, *P < 0.05, Mann–Whitney U test
