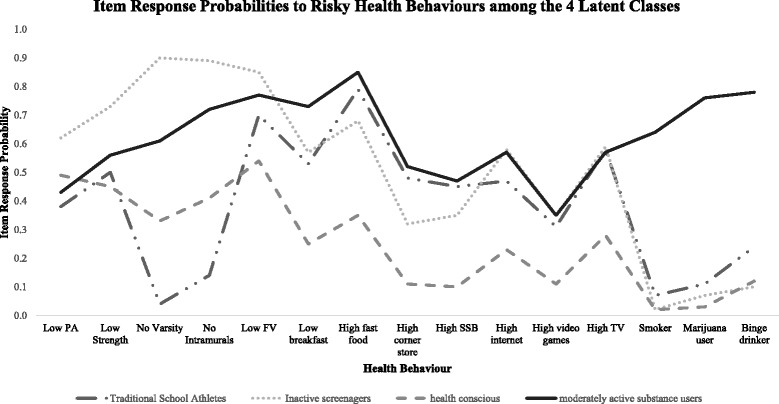
Fig. 1.

Graphical display of item-response probabilities for health behaviours across the four classes resulting from the LCA in the total sample (n = 18,587) from Year 1 (2012–13) of the COMPASS Study in Ontario, Canada. Health conscious youth (cluster 3) have the overall healthiest item response probability profile across the latent classes. The inactive screenagers and moderately active substance users had higher item response probabilities for a larger number of obesity-related and substance use behaviours
