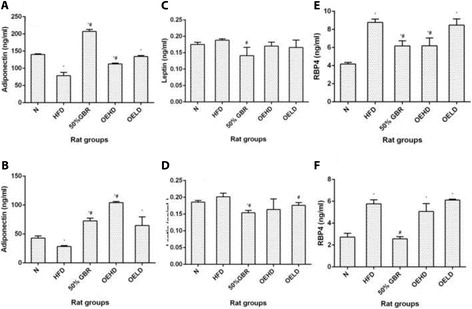
Fig. 3.

Serum adiponectin levels in dams (a) and offsprings (b), and serum leptin levels in dams (c) and offsprings (d), serum retinol binding protein 4 (RBP4) levels of dams (e) and offsprings (f). Data for dams and offsprings represent mean ± SD (n = 3) and mean ± SD (n = 6), respectively. Bars with * indicates statistical difference in comparison with HFD group (p < 0.05), # indicates statistical difference in comparison with N group (p < 0.05). Groupings are the same as Fig. 1
