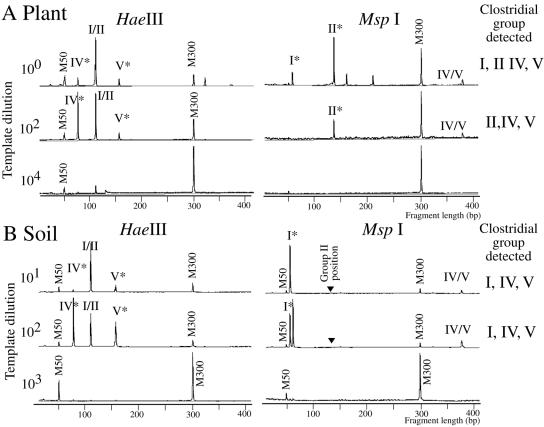
FIG. 4.
TRFLP profiles of HaeIII- and MspI-digested 16S rRNA genes amplified from DNA extracts of M. sinensis stems (A) and from soil near the stand of plants (B). Clostridial groups (I, II, IV, and V) were identified by the TRF sizes shown in Table 3. M50 and M300 indicate size markers of 50 and 300 bp, respectively. Asterisks show peaks specific to clostridial groups. Arrowheads indicate the positions of group II-specific clostridia. Note that the TRF signal of group II clostridia was not detected in the soil (B) but was detected in plant stems (A).

