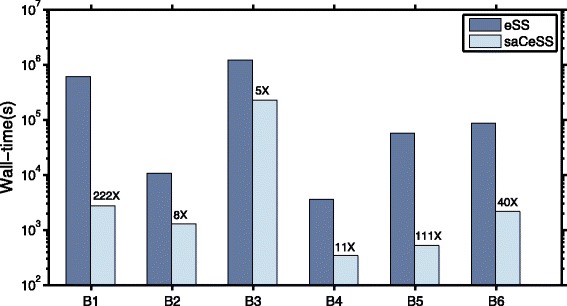
Fig. 10.

Performance acceleration of saCeSS versus eSS (as reported in [66]). Bars show wall-clock times for each solver and benchmark problem, with the numbers over saCeSS bars indicating the overall acceleration obtained. Computations with saCeSS were carried out with 10 processors while computations with eSS were carried out with 1 processor
