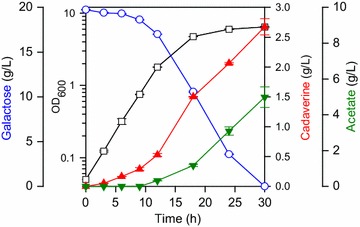
Fig. 3.

Time-course fermentation profiles of the DHK4 strain. The left y-offset, right y-axis and right y-offset represent galactose, cadaverine, and acetate concentrations (g/L), respectively. The left y-axis represents OD600. The x-axis represents the culture time (h). The error bars indicate the standard deviations of measurements from two independent cultures. Symbols: open rectangle, OD600; open circle, galactose; closed upward triangle, cadaverine; closed downward triangle, acetate
