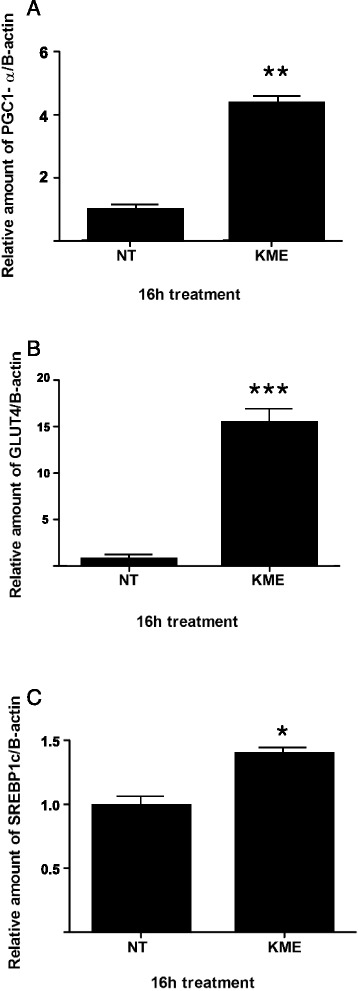
Fig. 4.

The induction of muscle atrophy and hypertrophy related gene expression by KME. a The relative amount of PGC-1α is shown. b The relative amount of GLUT4 is shown. c The relative amount of SREBP-1c is shown. All the analyses were performed after treatment of KME at a final concentration of 100 μg/ml. The mRNA expression levels were compared to β-actin. Data are shown as means of the relative expression levels ± SEM. P-values of < 0.05 and < 0.01 are indicated by * and **, respectively
