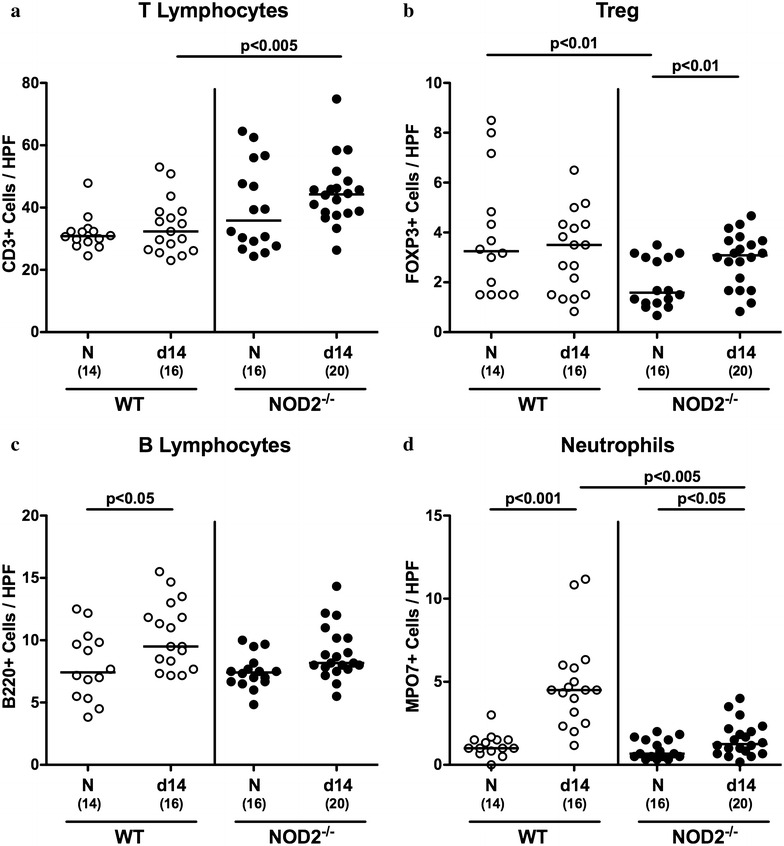
Fig. 4.

Colonic immune cell responses in C. jejuni infected conventionally colonized NOD2−/− mice. Wildtype (WT; white circles) and NOD2−/− mice (black circles) were perorally infected with C. jejuni strain 81–176 on three consecutive days (d0, 1 and 2). The average number of colonic a T lymphocytes (positive for CD3) b regulatory T cells (Treg, positive for FOXP3) c B lymphocytes (positive for B220) and d neutrophils (positive for MPO7) from six high power fields (HPF, 400× magnification) per animal was determined microscopically in immunohistochemically stained colonic paraffin sections at day 14 following C. jejuni infection. Naive (N) mice served as uninfected controls. Medians (black bars), levels of significance (p values) determined by Mann–Whitney U test and numbers of analyzed animals (in parentheses) are indicated. Data were pooled from four independent experiments
