
Fig. 1.
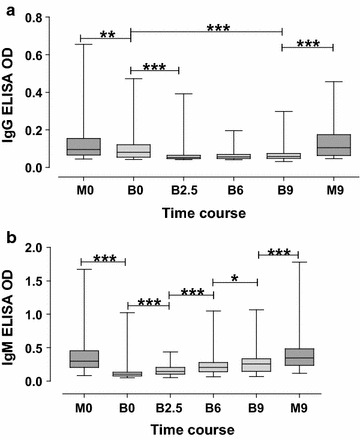
Development of IgG and IgM antibody responses to Plasmodium falciparum. The development of IgG and IgM antibodies in plasma against P. falciparum schizont extract was analyzed by ELISA using plasma specimens of mother–baby pairs (n = 109). The graphs show levels of IgG (graph a) and IgM (graph b) in plasma of blood collected from babies at birth, 2.5, 6 and 9 months later (see coordinate axis labels B0, B2.5, B6 and B9) and from mothers at delivery and 9 months later (M0 and M9). There was no difference in the levels of IgG and IgM for mothers at birth and 9 months later. At birth, babies had lower levels of IgG (a) and IgM (b) as compared to their mothers. Levels of IgG and IgM in babies increased over time although they did not reach the levels prevailing in the mothers’ blood at 9 months after baby delivery. The horizontal lines in the box plots with whiskers from minimum to maximum show median levels. Asterisk, double and triple asterisks indicate significant differences (p < 0.05, 0.01 and 0.001, respectively) between groups as evaluated by Wilcoxon rank sum test