
Fig. 5.
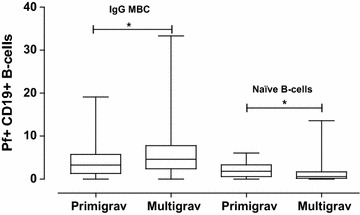
Comparison of primigravidae and mutigravidae. Comparison of proportions of Pf+ CD19+ IgG MBC and Pf+ naïve B-cells between primigravidae and multigravidae at birth. The horizontal lines show median levels in the box plots, with whiskers from minimum to maximum. Asterisks indicates significant differences (p < 0.05)