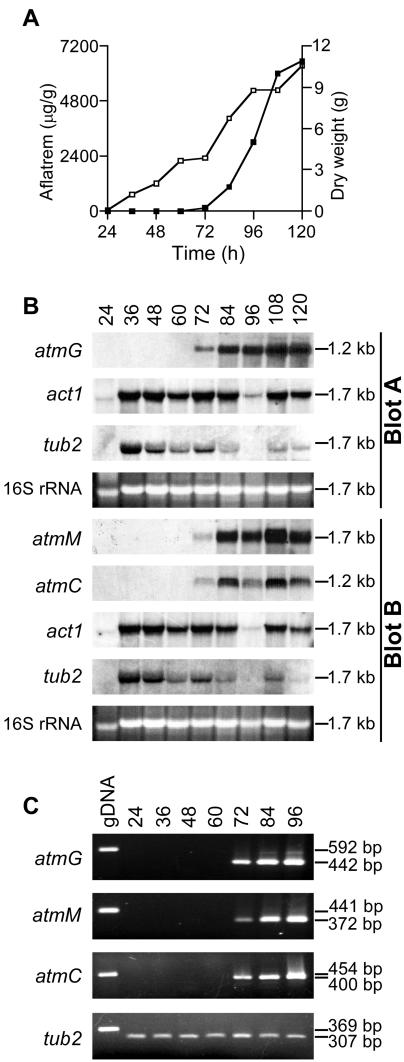
FIG. 5.
Gene expression analysis. (A) Growth of A. flavus showing changes in dry weight (□) and aflatrem production (▪). (B) Autoradiographs of Northern blots of A. flavus total RNAs (10 μg) probed with 32P-labeled 568-bp atmG, 400-bp atmC, 372-bp atmM, 562-bp act1, and 358-bp tub2 cDNAs. The ethidium bromide-stained 16S rRNA region of each gel is shown for comparison. The numbers on the right correspond to the sizes of the hybridized transcripts by comparison to a set of RNA standards (Promega). (C) RT-PCR analysis from 24 to 96 h, with mRNA as the template together with the genomic product (gDNA). Fragment sizes are indicated in base pairs.

