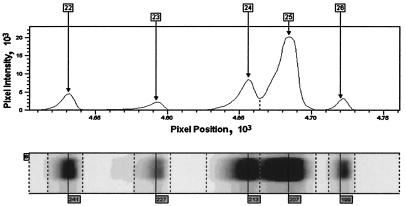
FIG. 1.
Gel image and band extraction. The figure shows both the trace from a region of an electrophoretic lane that forms the basis of the band assignment and signal intensity measurement process (upper panel) and the corresponding image from which this trace is derived as it appears on the automated sequencer output (lower panel).

