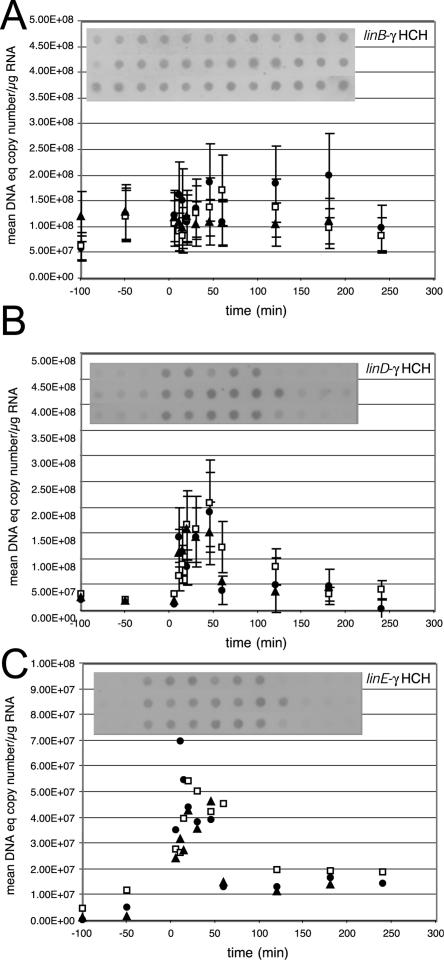
FIG. 2.
Amounts of lin-specific mRNAs before and after induction with γ-HCH (7 mg/liter). At time zero a single HCH dose was added to the chemostat culture of S. paucimobilis B90A. Panels show mRNAs probed with different antisense mRNAs, as indicated in the right top of each panel. The corresponding autoradiogram used for scanning is included within the graphs. The mRNA amounts are represented as mean DNA equivalent copy number (by comparing to a DNA standard, as explained in Materials and Methods) per microgram of RNA loaded in each spot. A different symbol is used for data from each of three independent induction experiments.

