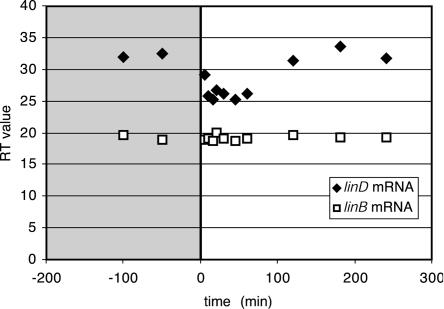
FIG. 3.
Real-time PCR analysis of linB and linD gene expression in S. paucimobilis B90A. The mRNAs were purified from the induction experiment with γ-HCH (7 mg/liter) as described in the legend of Fig. 2. The time sequence is that described in the legend of Fig. 2. The y axis shows the threshold cycle number during which exponential amplification starts.

