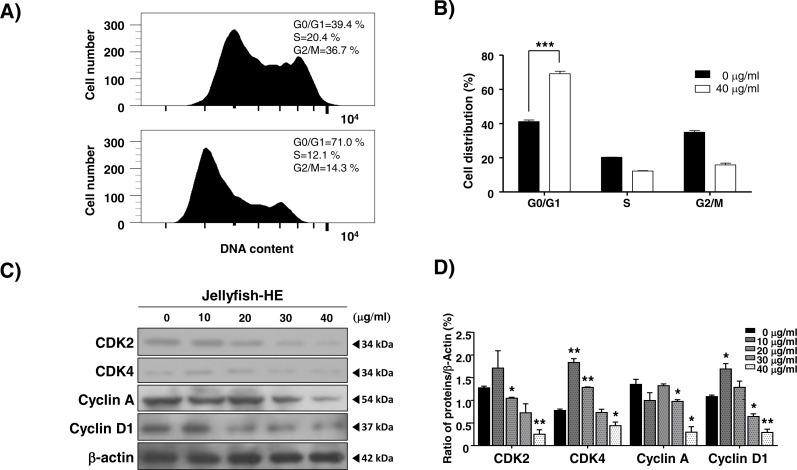
Figure 6. Jellyfish hexane extract induces cell cycle arrest.
(A) After treatment of cells with or without 40 µg/ml Jellyfish-HE, DNA contents were analyzed by flow cytometer, FACS Canto II. (B) Analysis of cell distribution was quantified using Graph Pad Prism software 5.0. (C) After treatment of cells with various concentrations (0, 10, 20, 30, and 40 µg/ml) of Jellyfish-HE for 24 h, the cells were analyzed by immunoblotting with antibodies for CDK2, CDK4, Cyclin A, and cyclin D1. β-Actin was used as a loading control. (D) Band intensities were quantified using Image J software. * P < 0.05 and **P < 0.005 vs. control (untreated).

