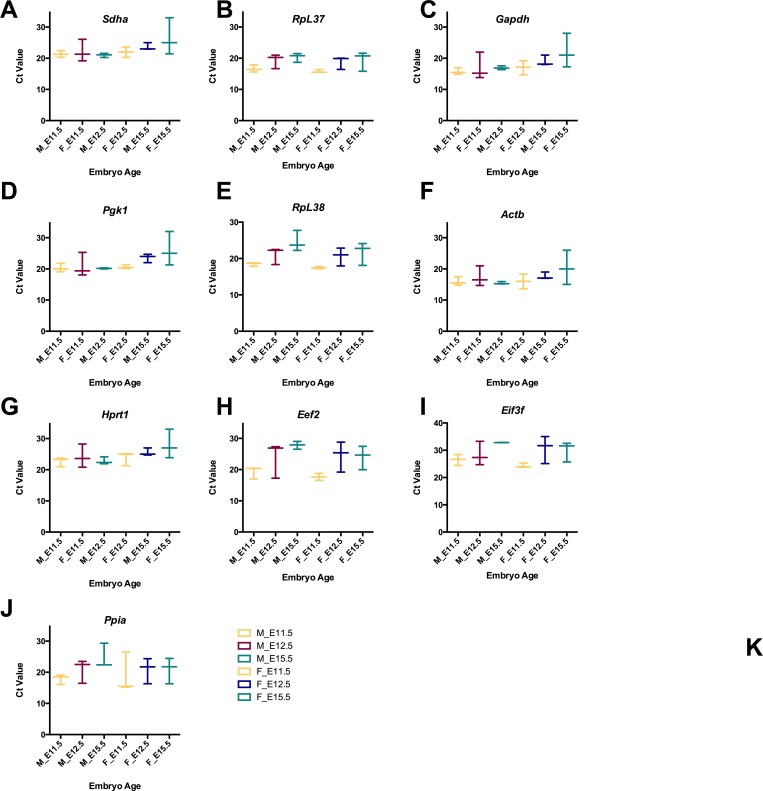
Figure 2. Raw Ct values for selected reference genes from RT-qPCR using cDNA from male and female brain tissue.
(A) Raw Ct values for each reference gene are shown for female and male samples by developmental stage. Data is plotted as floating bar plot, with min and maximum values indicated and a line at the mean for each stage (E11.5, E12.5 and E15.5).

