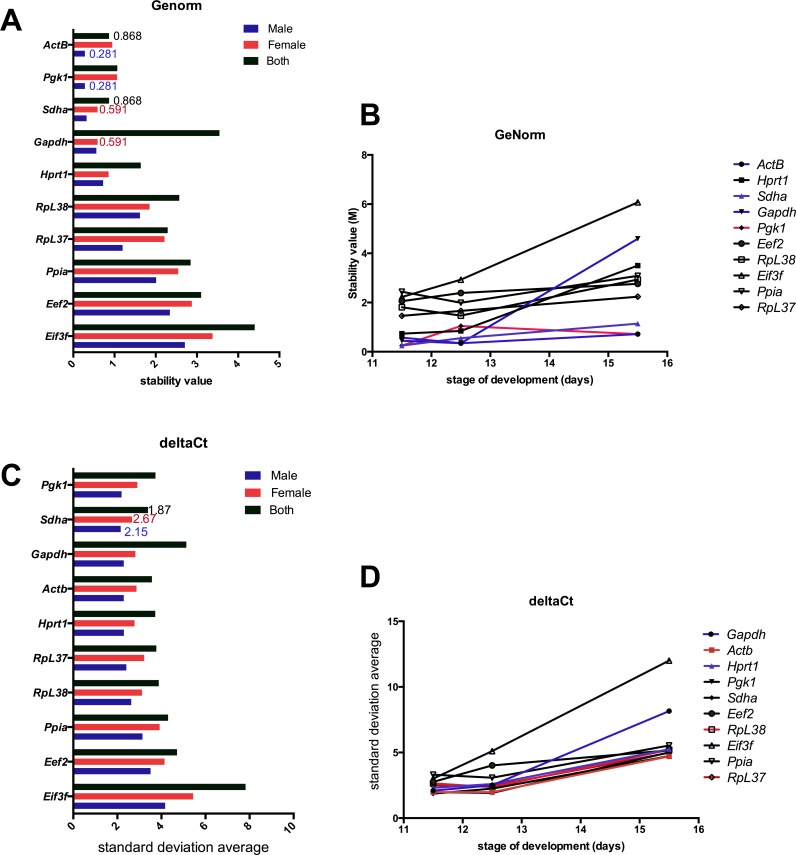
Figure 4. Comparison of stability values for GeNorm and deltaCt methods.
(A) Stability (M) value calculated by GeNorm across time in both male and female samples. (B) GeNorm mean stability (M) values in male and female samples across all developmental stages. (C) Average standard deviation using the deltaCt method for male, female and combined samples. (D) Average standard deviation using the deltaCt method for each time point tested. The lowest stability value for each sex is shown (Female, red; Male, blue; Both sexes, black).

