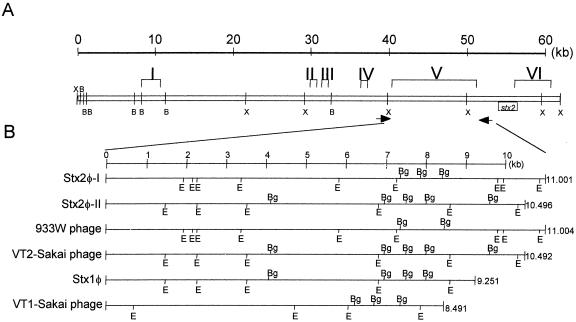
FIG. 1.
(A) Restriction map of the Stx2φ-I genome and the location of the six characteristic regions (I to VI). B and X represent BamHI and XhoI, respectively. Arrows indicate the location of primers. (B) Restriction map of region V in six Stx phages. Bg and E represent BglI and EcoRV, respectively.

