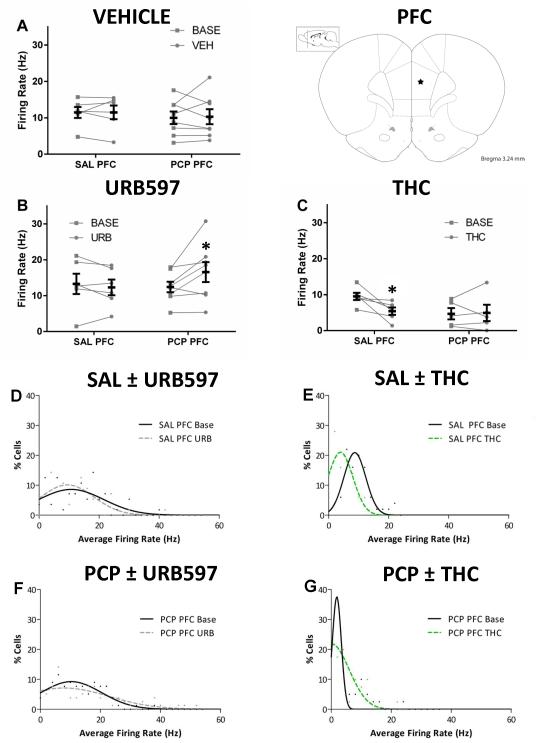
Figure 3. Single unit activity in the PFC.
Before-after plots of the average mPFC firing rate per animal at baseline and 120 minutes after acute treatment of vehicle (A), URB597 (B), or THC (C). Group means are in foreground (black) while individual animal means are in the background (grey). URB597 increases the average firing rate of mPFC cells in PCP but not saline treated animals (B). THC decreases the average firing rate of mPFC cells in saline but not PCP treated animals (C). Frequency histograms (D-G) were fit by Gaussian models and effects of URB597 or THC can be seen as shifts in the distribution. * represents significant difference from baseline (two-way RM ANOVA p<0.05)

