Fig. 7.

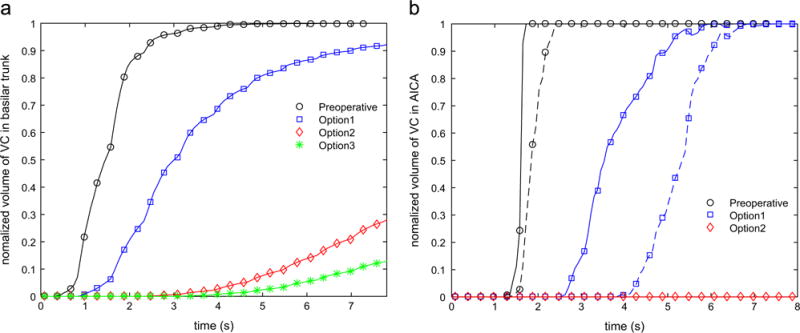
Variation of the normalized volume of the VC in (a) basilar trunk and (b) AICAs during ten cardiac cycles following the injection; in panel (b) the solid and dashed lines correspond to the left and right AICAs, respectively.

Variation of the normalized volume of the VC in (a) basilar trunk and (b) AICAs during ten cardiac cycles following the injection; in panel (b) the solid and dashed lines correspond to the left and right AICAs, respectively.