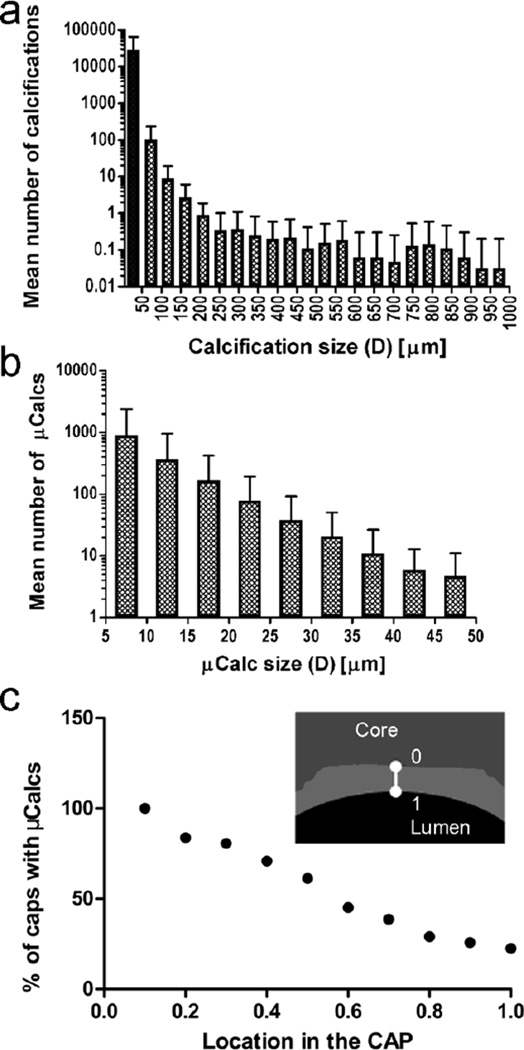
Fig. 4.
Mean number of calcifications classified by equivalent spherical diameter, D, that were identified using HR-μCT at 2.1-μm resolution a in whole atheroma (n=72), and b in the cap of atheromas (n=27). Microcalcifications, with 5μm < D < 50μm are shown in the shaded bar in panel a c Location of microcalcifications in fibrous caps (n=27). Percentage of fibrous caps with microcalcifications located at different positions in trough the cap thickness, where 0 is closer to the lipid/necrotic core and 1 is closest to lumen. Showing how the majority of microcalcifications are located close to the core boundary

