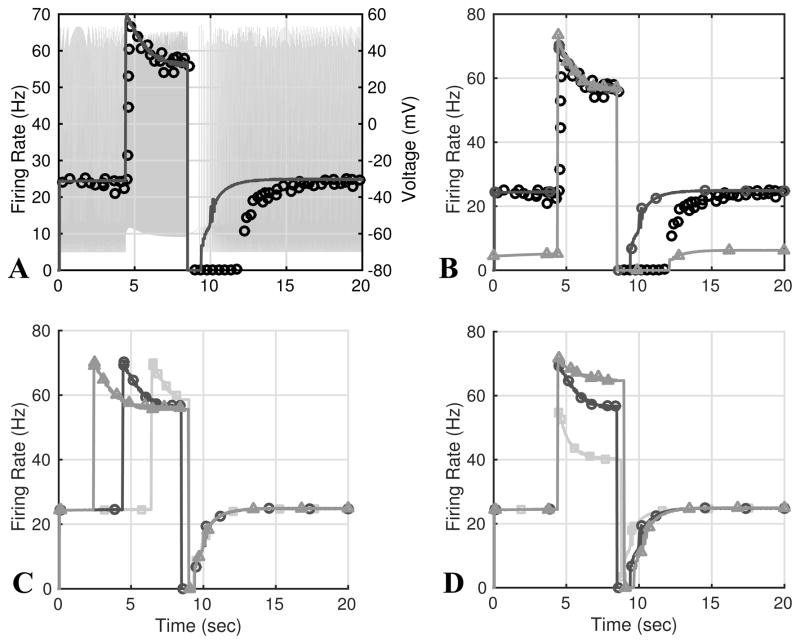
Fig. 10.
Using parameters estimated in response to the step stimulus used in Fig. 9, we were able to reproduce PED. We stimulated the model with a pressure pulse changing from 120 to 156 mmHg with a duration of 4.1 sec and compared the predicted firing rate to that of rat A-type neurons reported by Saum et al. (1976). The computed and experimental firing rates are shown in A. B shows results of varying gm, ε½, S½, and β2 to match the duration of the PED. These parameter changes results in a lower the baseline firing rate (lighter curve with triangle markers). C and D show results of increasing the length (2.1 (squares), 4.1 (circles), and 6.1 (triangles) sec) and amplitude (15 (squares), 20 (circles), and 50 (triangles) mmHg) of the pressure pulse.

